See concentration
Look beyond the number of positions. Examine how much of a portfolio sits in individual companies and shared sectors.
A list of holdings does not tell the whole story. Portfolio X-Ray brings the companies in your portfolio into context, helping you inspect concentration and the exposures they have in common.
Free public Explore · No card or trial · Personal workspace requires Pro
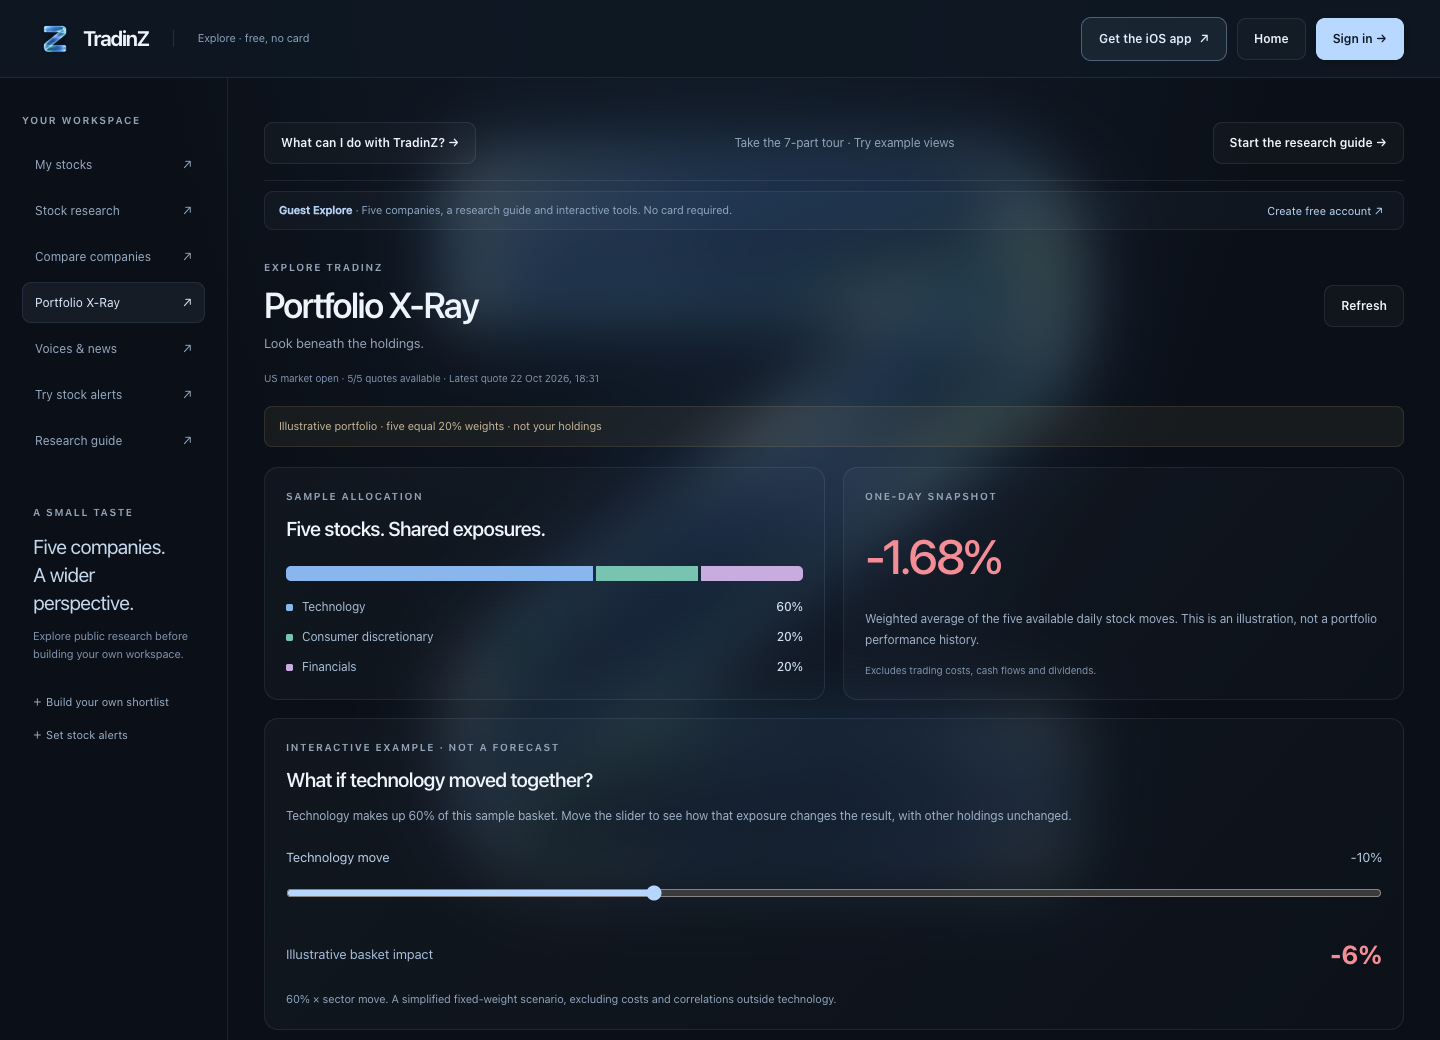
Portfolio X-Ray is TradinZ’s portfolio research view. It puts holdings and shared exposures in context, with descriptive signals drawn from the underlying company research. Public Explore provides a labelled sample portfolio; TradinZ Pro unlocks the personal workspace and X-Ray for your own holdings.
Look beyond the number of positions. Examine how much of a portfolio sits in individual companies and shared sectors.
Different companies can depend on the same customers, industry or spending cycle. Use the research context to identify connections worth investigating.
Inspect the businesses behind your allocation and the available company signals. X-Ray describes the information; it does not choose trades or allocations for you.
Public Explore uses Apple, Microsoft, NVIDIA, Amazon and JPMorgan Chase at equal 20% weights. These are example holdings, not a suggested portfolio.
Apple, Microsoft and NVIDIA account for 60% of this sample under its technology classification. Five equal positions do not mean five independent exposures.
In the example, a 10% fall across that 60% technology allocation implies a 6% basket decline if everything else stays unchanged. This arithmetic illustration excludes costs and other market effects; it is not a forecast.
No. The public preview is an explicitly labelled, five-stock example. It does not connect to your accounts or represent your portfolio.
You can enter holdings manually. Check the integrations currently supported in the app if you prefer a connected snapshot. The public example needs no broker connection.
No. The public slider illustrates a simplified fixed-weight calculation for the sample basket, holding other prices unchanged. Actual outcomes can differ and the example is not a comprehensive risk model.
The public example is free to explore without a card or trial. Your own holdings and personal X-Ray require TradinZ Pro.
No. Its aggregations and labels describe research signals and exposures. They do not consider your personal circumstances or recommend transactions.
Product information reviewed 22 October 2026. Read the methodology and data limitations ↗
Try the public example, then decide whether TradinZ fits your research routine.
Try the example X-Ray ↗